Anonymous, "Toxic Data Representation and Argumentation", contributed by Danica Loucks, Center for Ethnography, Platform for Experimental Collaborative Ethnography, last modified 1 March 2020, accessed 24 April 2024. http://www.centerforethnography.org/content/toxic-data-representation-and-argumentation

Critical Commentary
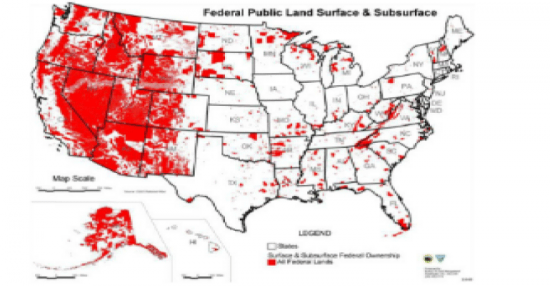
This image, showing total surface and subsurface federal ownership in the United States, is a visual tool used in news articles, blog posts, reports, and social media posts) that is one variation of the toxicity found in public lands discourse. Similar to claims in other domains, such as in climate change discourse, this tactic furthers arguments by claiming legitimacy by using technically accurate data but omitting details to present something that is perhaps not quite false, but also not quite true.
This particular map is most often paired with anti-federal, anti-monument sentiments. It is is exemplary of the way in which some individuals and groups explicitly mark themselves as "playing by the rules" of facts and "correct" information, while also making decisions about how to display the data that may omit some details and highlight others to bolster a desired argument.
At first glance, the image appears to come from the Bureau of Land Management (BLM), one of the agencies within the Department of the Interior. In the bottom right-hand corner, the logo for the Department of the Interior and the Bureau of Land Management are printed at a very small scale with words unreadable unless digitally zoomed in that say "Produced by the Bureau of Land Management," dated 03/03/05. This reference to the BLM adds to perceived legitimacy on audiences' part, as if these anti-federal perspectives are strengthened by using the enemy's own data. However, this image does not appear on any formal government website (e.g. DOI or BLM), and one writer suggests it was originally created by the American Lands Council, a pro-states’ rights/state management and pro-private property think tank. If this is the case, the statement in very small letters that the map was produced by the BLM could be following the tactic of displaying information that is technically not false (i.e. the original geodata may have come from that agency) but is misleading. That finding the creator of the image and determining whether the DOI and BLM stamp is a "legitimate" use of the logo is quite difficult highlights the complex media environment in which both interlocutors and researchers are immersed.
The image does significant work in taking data that is "not false" to convey a message that feels not quite true, or at the very least misleading. In alarm-bell red, the map shows surface and subsurface areas owned by the federal government, but does not distinguish between types of federal land or the agencies managing them. A map differentiating types of federal land by how they are managed (by BLM, the forest service, the Department of Defense, the Bureau of Indian Affairs, and so on) would reflect the variation in how these spaces are used and how much includes public access. Thus, while the caption describes the shaded areas as "public lands," the areas include all federal land, including areas like military bases that are federally-owned but hardly public and erases/denies the presence and sovereignty of Native Nations and their associated reservation lands.
The effect is a sea of red demonstrating an overwhelmingly large area of federal land in the American West. When paired with written arguments, this sea of red is associated with such language as "land grab" and "seize" when describing federal-level management decisions (despite no changes in ownership) and with arguments that such an egregiously large area of land demonstrates a needlessly greedy federal government and that such land, though technically under the federal domain since before many western states achieved statehood, should "revert to the states." Interestingly, the use of language that indicates individuals or government entities stealing land from someone else is pervasive across political positions (e.g. see the lefthand image in this artifact).
This image shows the malleability of facts within discussions of a supposedly stable object--”public lands”--demonstrating how data representations such as maps can be used alongside charged terms to distort messages about public lands. These distortions may at first seem inconsequential, but as they shape the realities of anti-federal patriots, such ideas accrete to others that collectively form belief systems that justify drastic actions against the federal government and federal employees.