Anonymous, "1990s map that integrates census and Toxic Release Inventory data to show environmental injustice in Los Angeles", contributed by Kim Fortun, Center for Ethnography, Platform for Experimental Collaborative Ethnography, last modified 28 February 2020, accessed 28 April 2024. http://www.centerforethnography.org/content/1990s-map-integrates-census-and-toxic-release-inventory-data-show-environmental-injustice

Critical Commentary
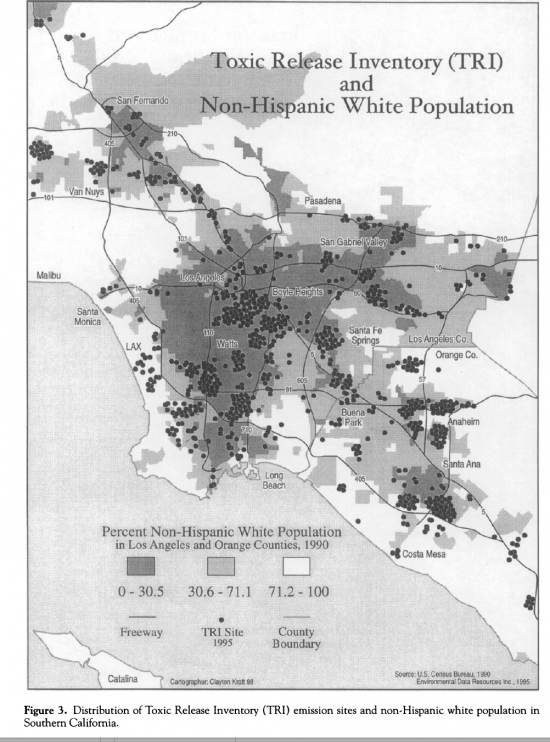
Map of Los Angeles from the late 1990s that combines census and TRI data to demonstrate environmental injustice. Drawn from: Pulido, Laura (2000) “Rethinking Environmental Racism: White Privilege and Urban Development in Southern California,” Annals of the Association of American Geographers. 90.1. March. p12-40.
caption: This GIS-produced map shows early use of data from the US Toxic Release Inventory (TRI), combined with census data, to demonstrate environmental injustice in Los Angeles. The TRI is a database of information about routine, mostly legal toxic emissions from large industrial facilities in the United States. The TRI was established in the wake of the December 1984 Bhopal chemical plant disaster through passage of the 1986 Emergency Planning and Community Right-to-Know Act (EPCRA) (later expanded it in the Pollution Prevention Act of 1990). From the start, TRI data was available to the public in a computer-readable format, allowing for creative use by academic, activist and government researchers (who often made use of use of newly available GIS technologies to show the significance of TRI data).
This visualization points to the many types of action, expertise and technology that must be brought together to make toxicity -- especially unequally distributed toxicity -- visible. In the United State, this began to happen in the late 1980s.
This visualization is part of the Toxic SoCal collection and Visualizing Toxic SoCal photo essay.